Bradford Score dashboard


What does it do?
The Bradford Score calculates a single risk score per employee — one that flags frequent short absences more aggressively than rare long ones — ranks the population by that score, groups it into severity bands, and lets managers drill into the underlying absence history before having a conversation. It turns scattered sick-day records into a single, sortable signal of who needs a check-in.
When should it be used?
Use this view as the go-to absence-pattern workspace for People teams and line managers. It's most useful in the lead-up to manager 1:1s, before quarterly performance conversations, when preparing return-to-work meetings, or when a team is showing capacity issues that may be absence-driven rather than workload-driven. It's also valuable as a quarterly hygiene check, when investigating team-level burnout or morale concerns, and as part of return-to-work planning after a known cluster of illness. The view is designed to be diagnostic, not punitive. It surfaces patterns early so support can happen before situations escalate to formal processes.
What's inside?
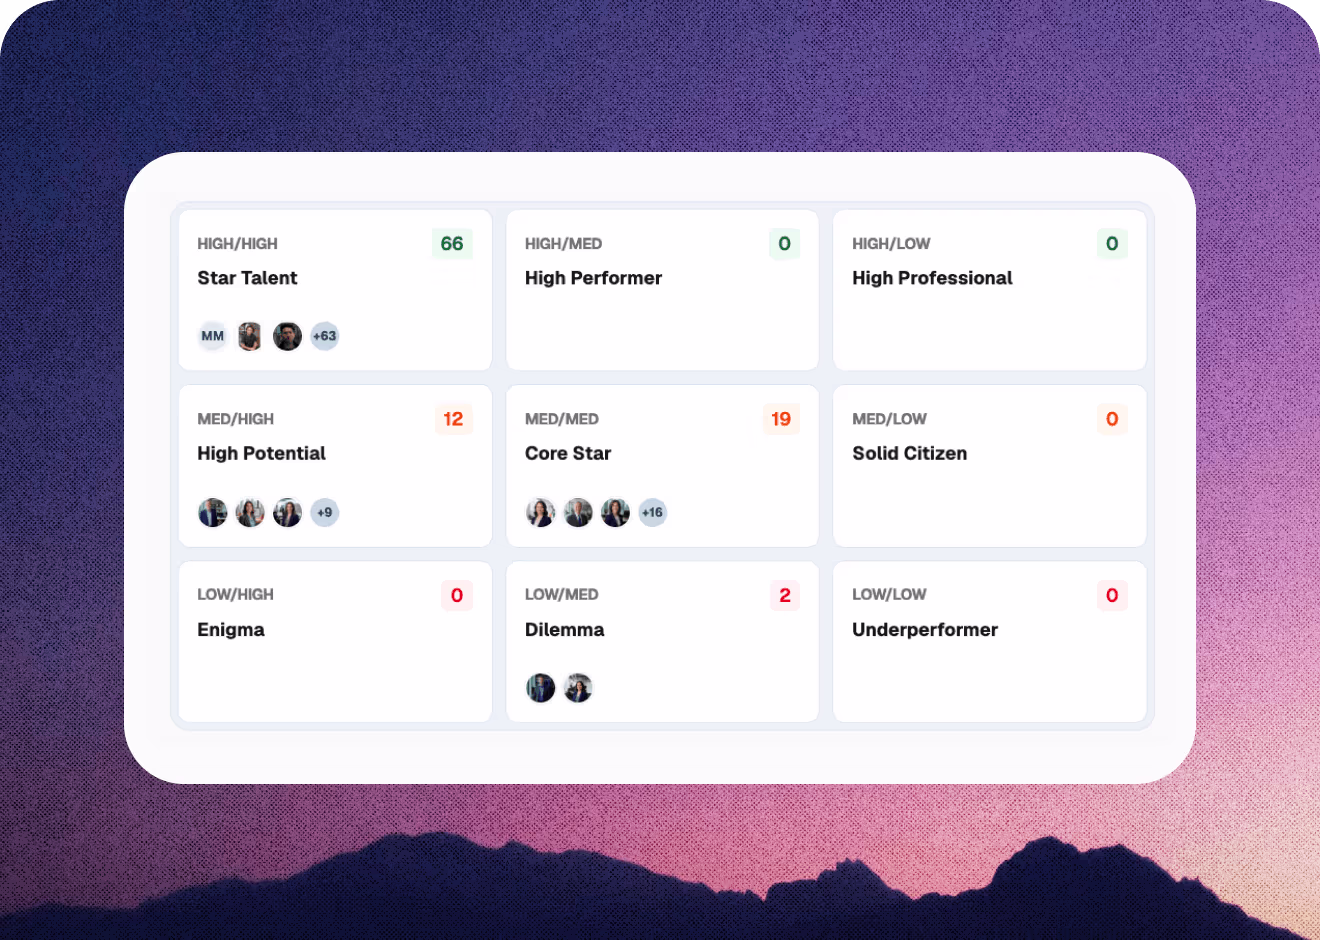
- Four KPIs at the top covering the filtered population: average Bradford Score, employees above the action threshold of 125, total absence instances, and total days absent. This gives an immediate read on absence health across the org or a specific team.
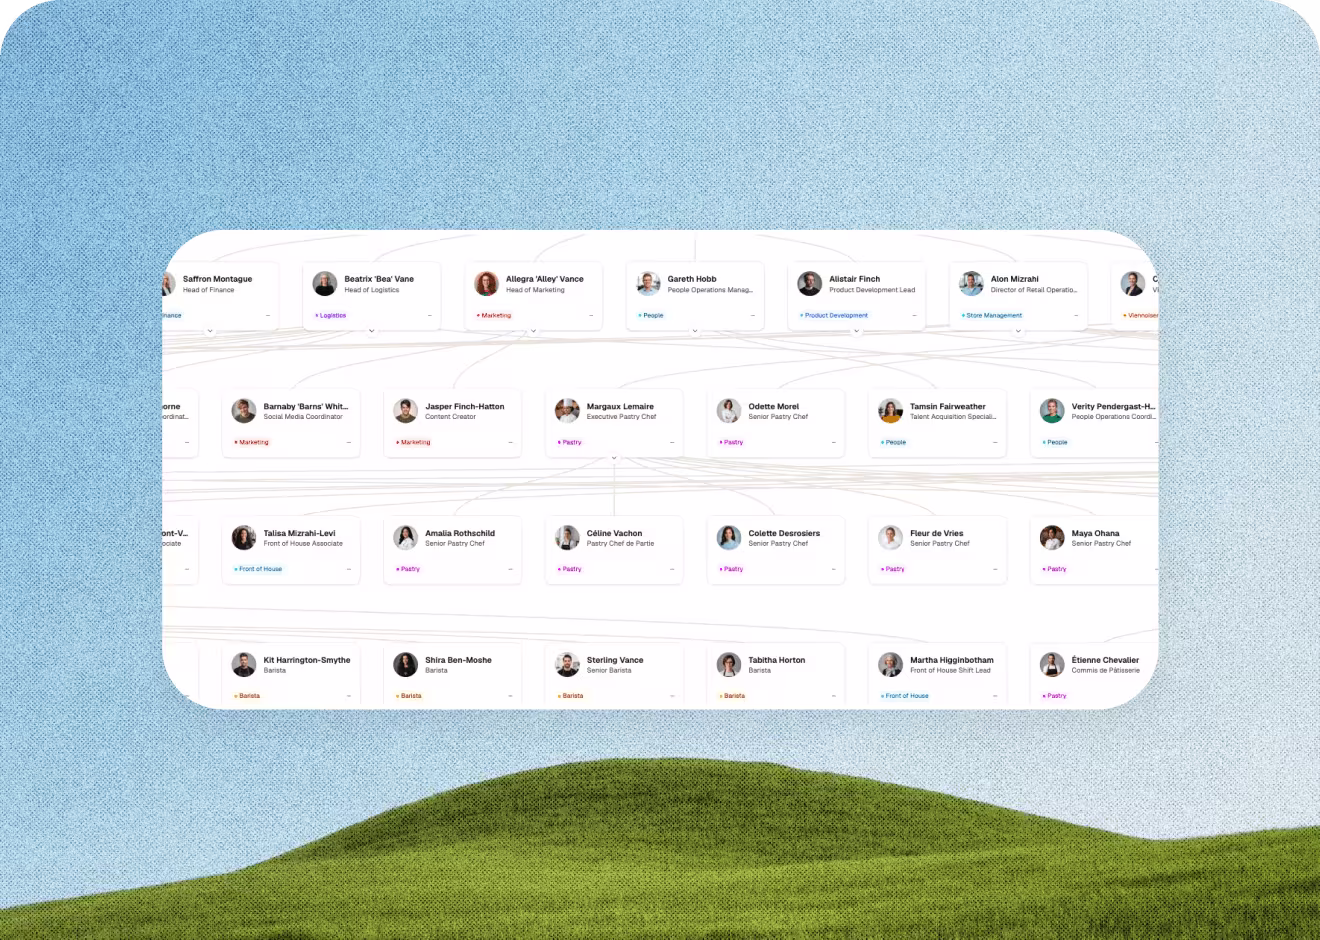
- A ranked employee table sorted by score descending, with columns for employee, team, instances (S), days absent (D), Bradford Score, a coloured band pill (Healthy / Monitor / Action / Formal), and trend vs. the previous equivalent period.
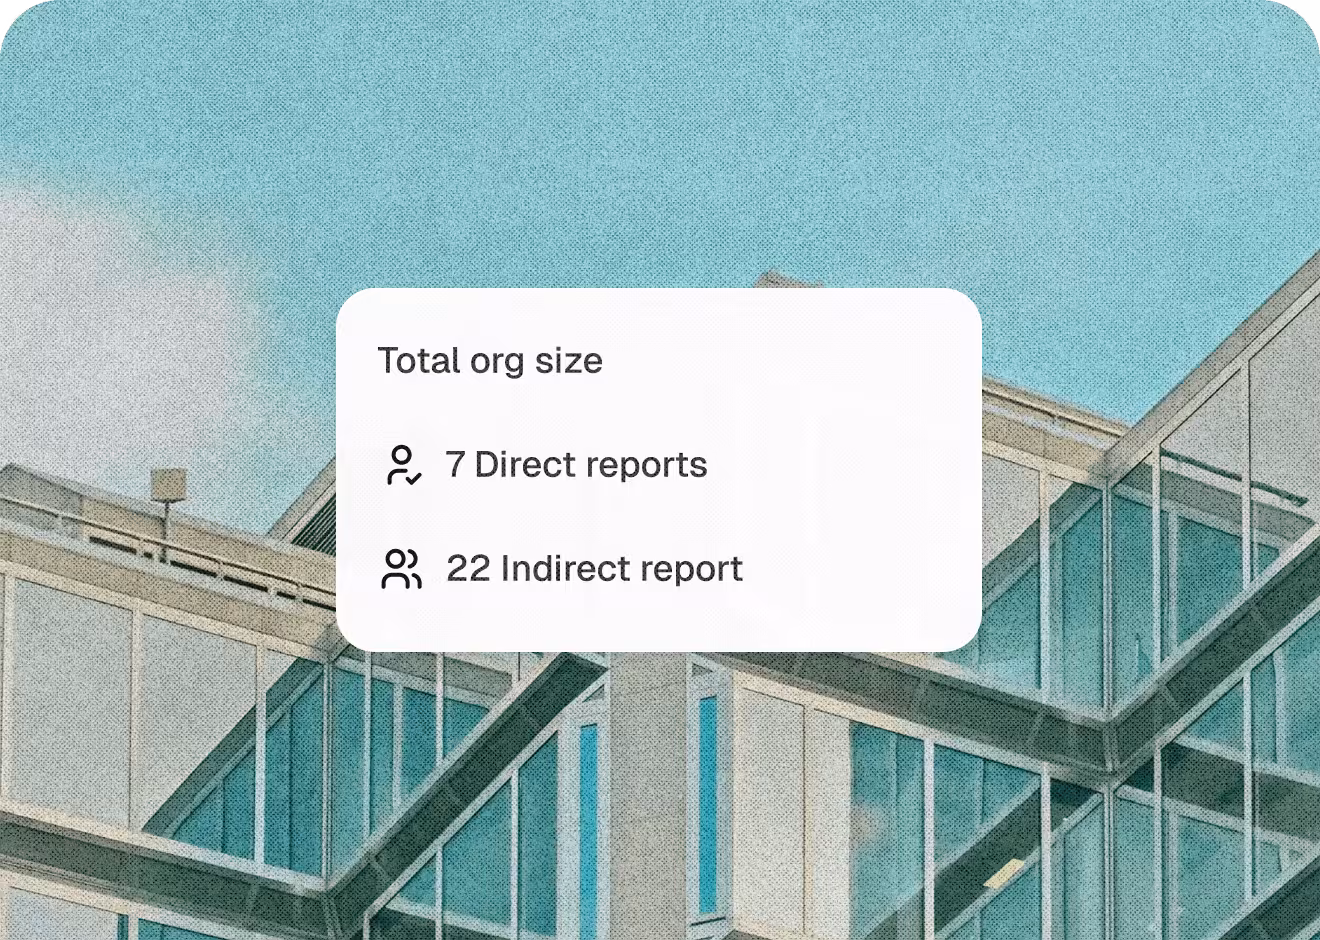
- A side panel that opens on row click, showing the employee's full absence history: dates, durations, types, and notes. This way managers can review context before having a conversation.
- A sticky filter bar scoping the view by team (multi-select) and timeline: Last 90 days, 6 months, rolling 12 months (default), YTD, or custom.
- An “About Bradford Score” button opening an explainer with the formula (B = S² × D), two worked examples, excluded leave types, and the four threshold bands.