Performance review trends

What does it do?
A longitudinal performance view that shows how ratings and review completion have moved across departments and the organisation as a whole, cycle over cycle. Rather than showing where people stand today, it shows the direction of travel — which teams are improving, which are plateauing, and where completion or ratings have dipped. It turns individual review data into a trend picture that leaders can actually act on.
When should it be used?
After each review cycle closes, when you want to understand whether performance is moving in the right direction rather than just where it landed. Most useful for HR leaders tracking the impact of performance interventions, identifying departments that need support, or preparing a performance narrative for leadership. Also useful ahead of calibration when you want historical context alongside current-cycle data.
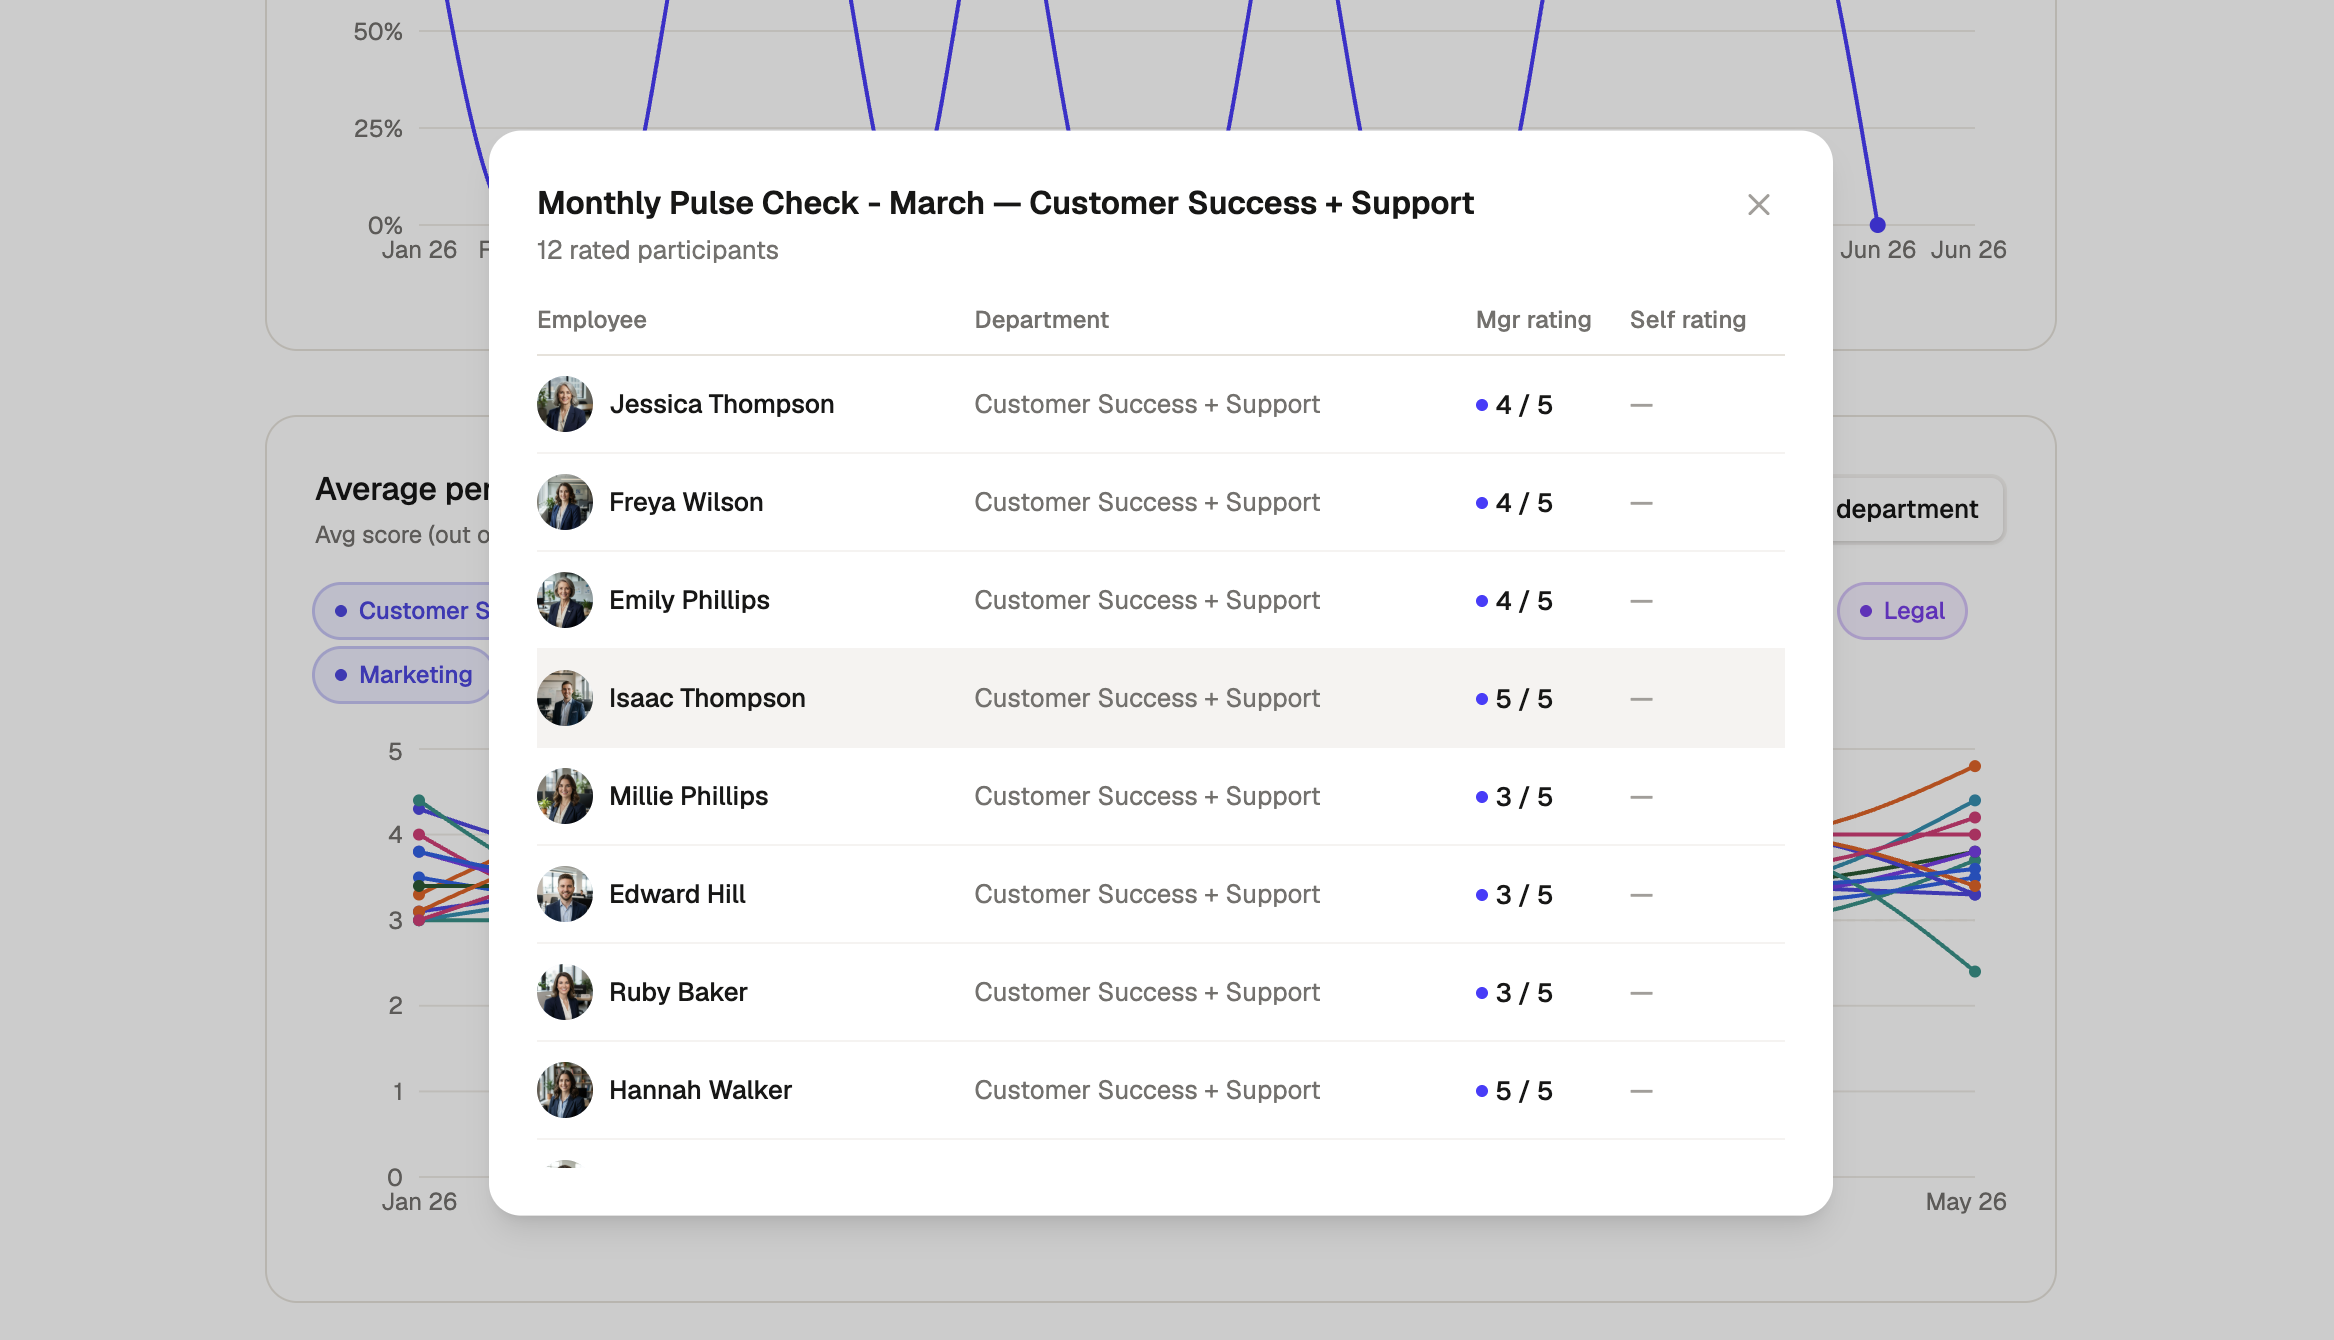
What's inside?
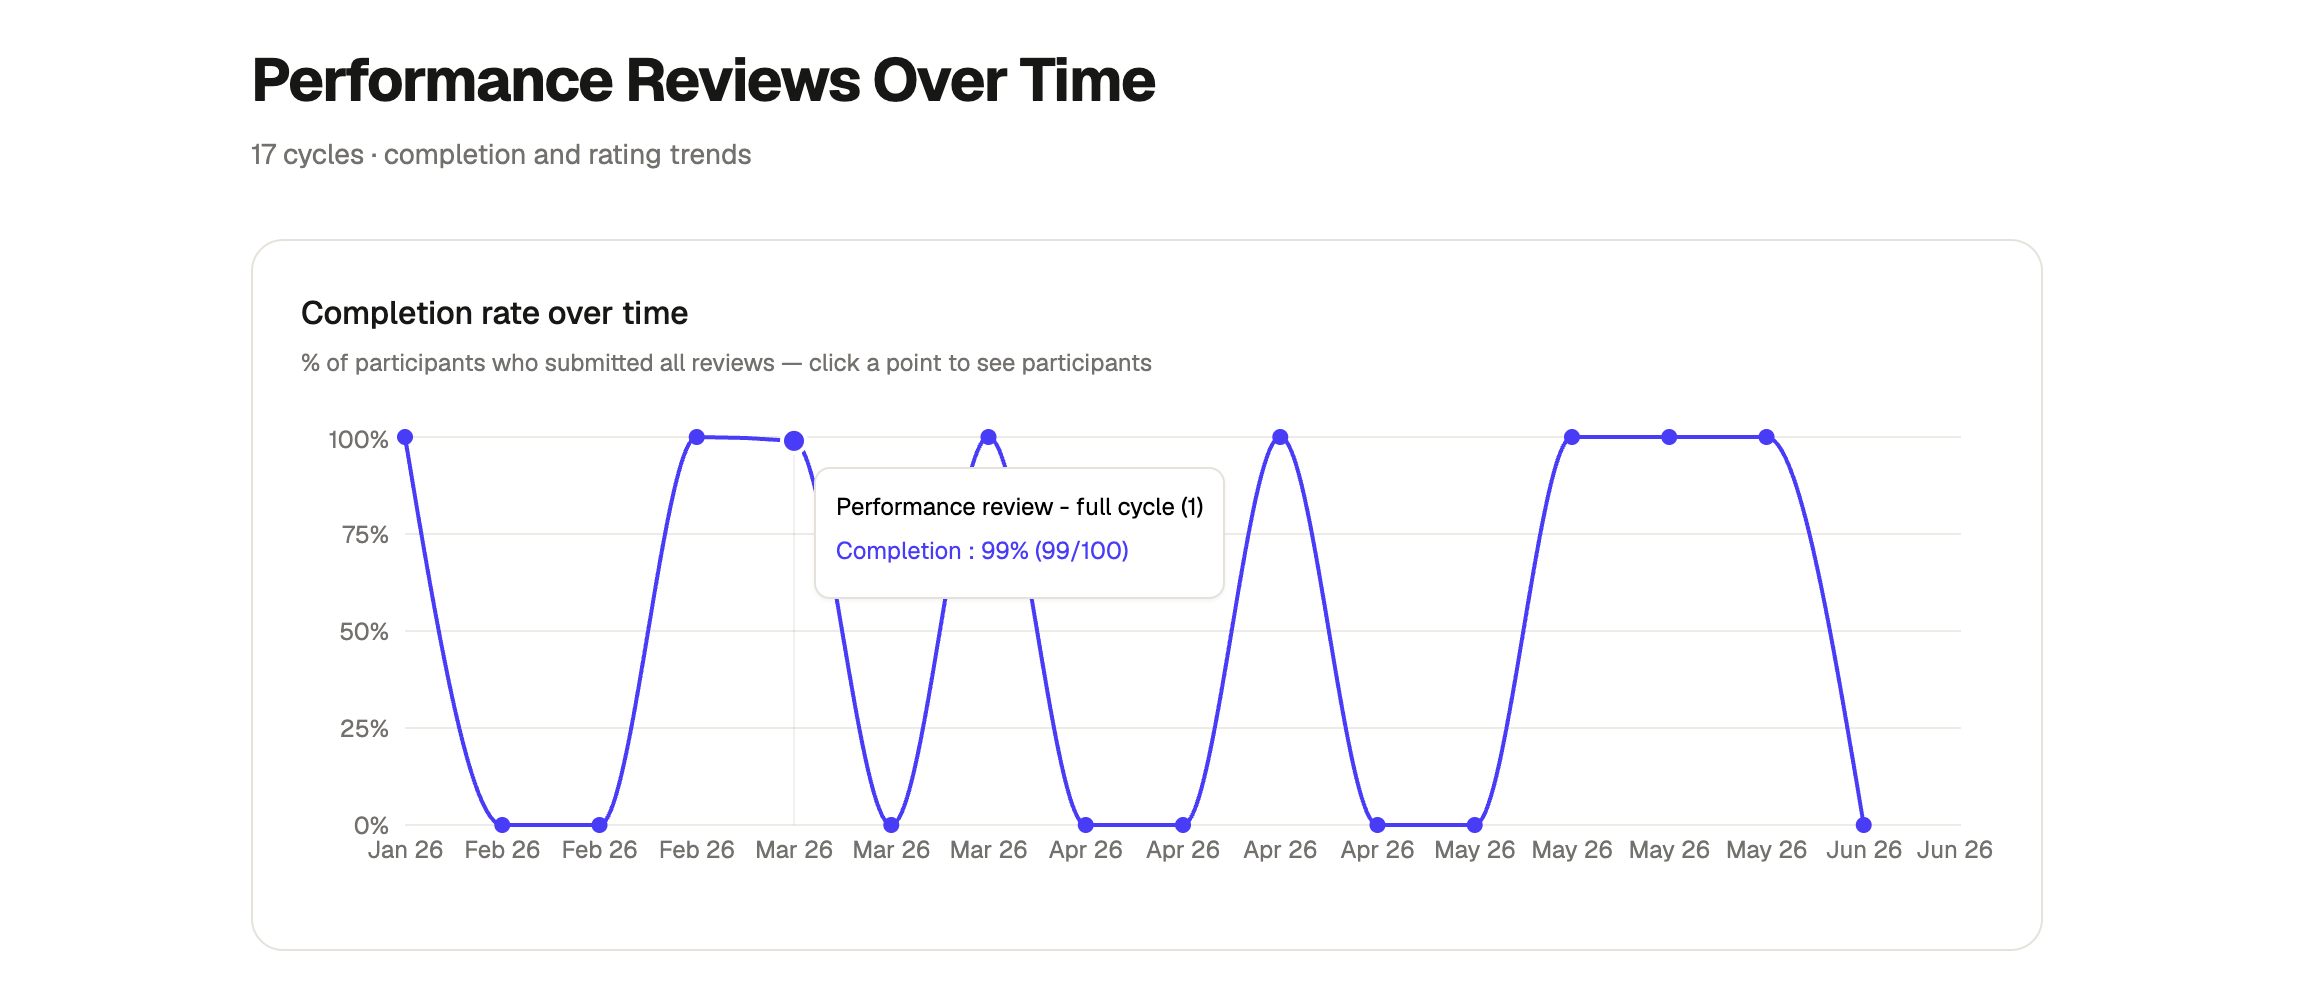
- A completion rate graph showing percentage completion by review period across the organisation, so gaps in participation are immediately visible.
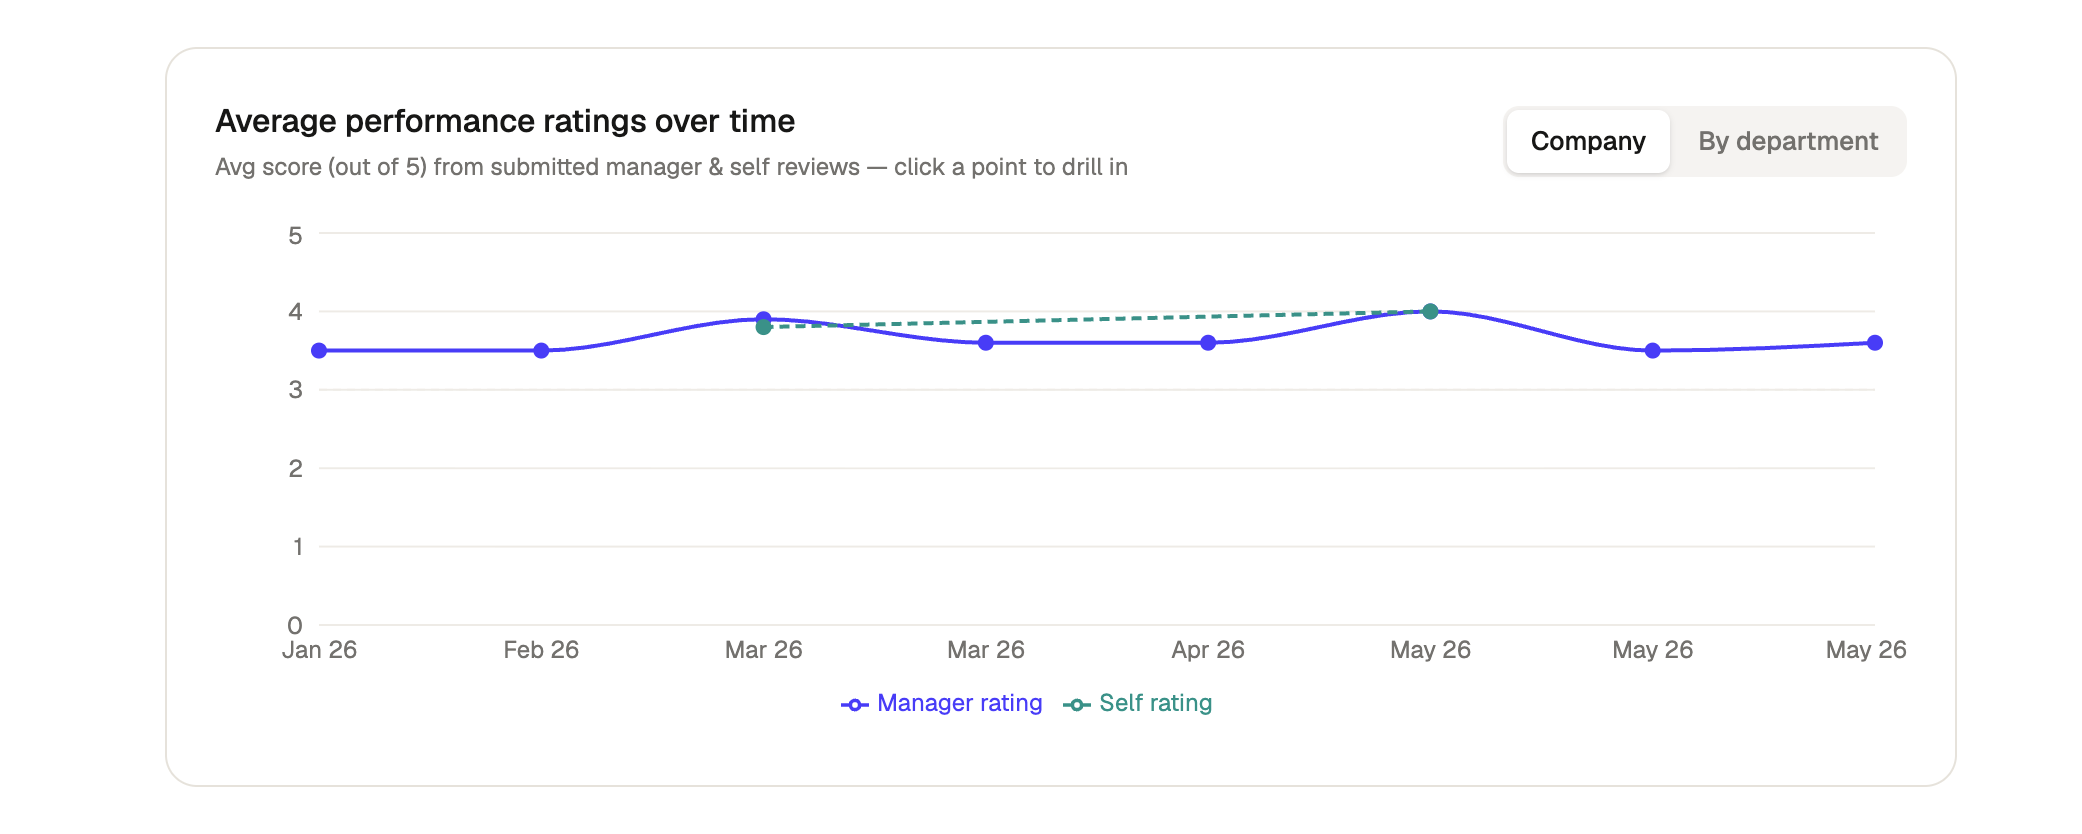
- A company-wide average ratings graph tracking how overall performance scores have shifted cycle over cycle.
- A department-level ratings graph with toggleable department lines, so you can isolate or compare specific teams without losing the broader picture.
- Filters for review cycle and department to scope either graph to what matters most.
.avif)